After months of simmering inflation reports, it looks like inflation finally eased slightly in April.1
Are prices stabilizing? Can we breathe a sigh of relief?
Let’s dig a little deeper.
What’s inside the latest inflation report?
Economists typically look at two major inflation gauges: the Consumer Price Index (CPI) and the Personal Consumption Expenditures Index (PCE).
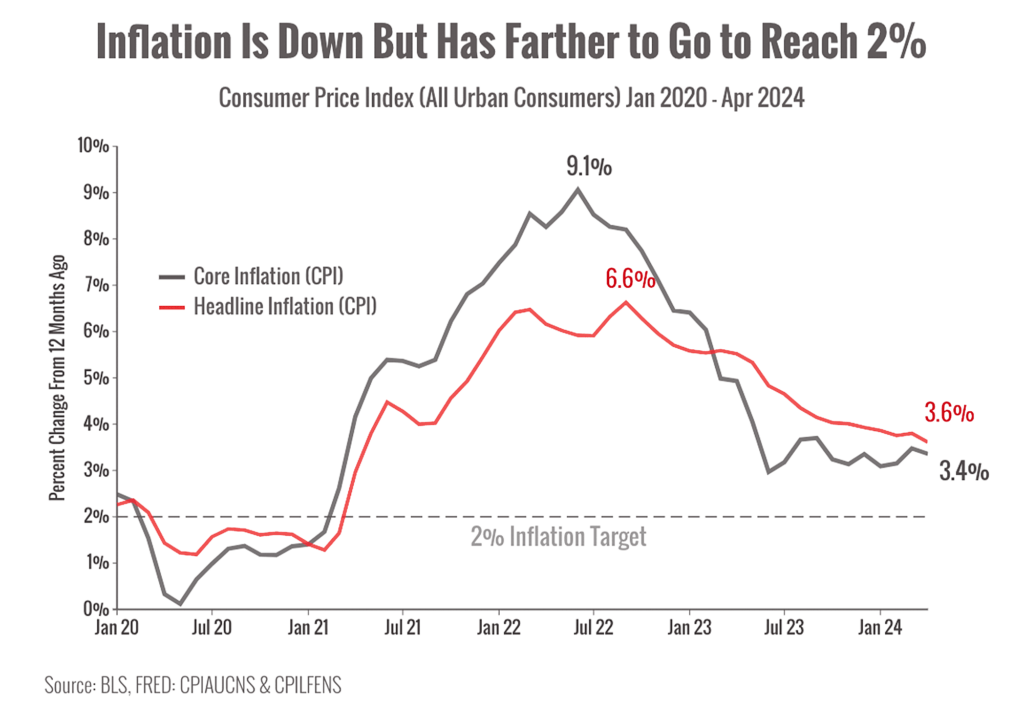
In the latest CPI report, we learned that overall “headline” inflation rose 3.4% (year-over-year) in April.1
Analysts also look at “core” inflation by stripping out volatile food and energy costs – that metric climbed 3.6%, the lowest since April 2021.
Why? Because food and energy have very volatile prices that can skew monthly data.
The chart below shows just how far inflation has come down since its 2022 peak.
Are we finally done with stubborn inflation?
I think it’s too soon to call since we’re just looking at one report.
Let’s see what the next few months show before celebrating.
We know inflation is still higher than anyone would like.
But, the April data is an improvement after months of hotter-than-expected data.
It could also be an optimistic sign that the Fed may still be able to achieve its 2% inflation target.
What does tamer inflation mean for investors?
Lower inflation points to a slowing economy and could give the Fed room to cut interest rates this year.
Traders have been telling themselves (and each other) that lower rates are coming in 2024 so they cheered the latest data.1
Stubborn inflation is the one obstacle holding the Fed back from lowering rates so any nudge in the right direction often triggers a rally.
Other signs also point to a cooling economy.
Multiple indicators of labor market strength are trending downward, which suggests that growth is slowing.
Just 175,000 jobs were added in April, missing expectations. Earlier jobs numbers were also revised downward, which often means early estimates were too optimistic.2
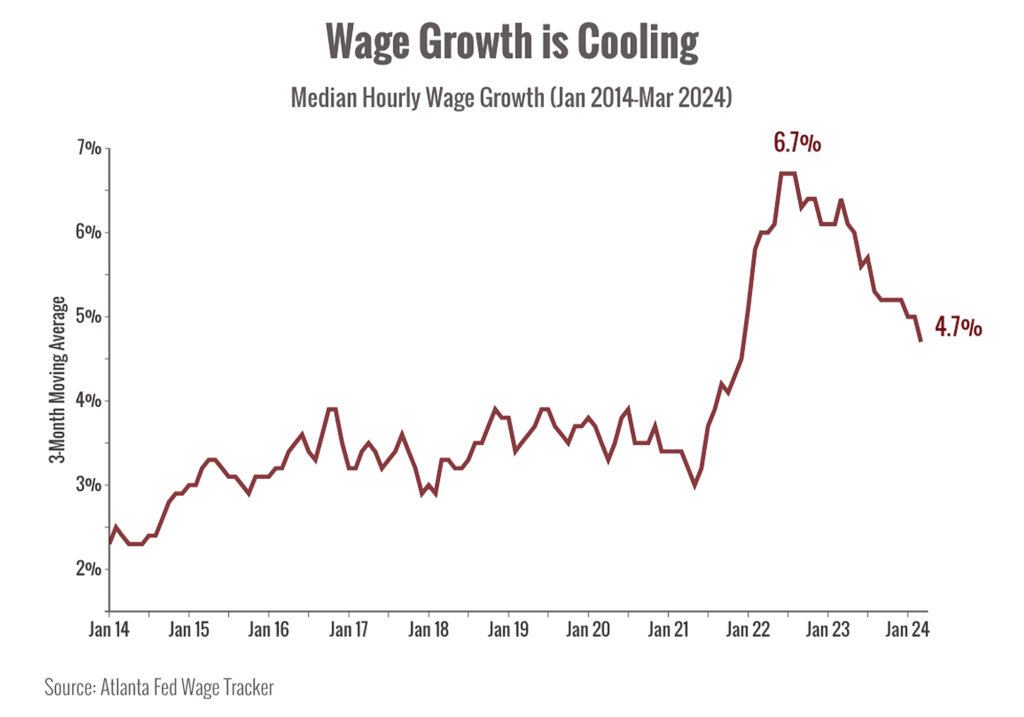
Wage growth, another sign of a strong labor market, has also slowed significantly in recent months.3
Wage gains surged in 2021 and 2022 as employers struggled to attract workers but have been slowing down since.
So, what does the latest data mean for you?
Markets are highly influenced by the timeline of future rate hikes this year.
That means news that the economy is slowing down may be treated as good news because it continues to build the case for lower rates.
On the other hand, signs that the Fed might keep rates high (or even raise them) may provoke more selloffs.
For long-term investors, these gyrations don’t make much difference to our goals and outcomes.
We’re more interested in trends and the bigger picture.
But that doesn’t mean we ignore what’s happening week-to-week or month-to-month.
My team and I are watching the data closely and we’ll pass along what’s relevant.
Sources:
2. https://www.bls.gov/news.
3. https://www.atlantafed.org/
Chart sources: https://fred.stlouisfed.org/

