
Since new tariffs (which are fees charged on imported goods) were announced last year, global trade has been a source of uncertainty for financial markets and the broader economy. In February, the Supreme Court ruled that the original “Liberation Day” tariffs were illegal, leading to a wave of refunds to businesses that are now well underway.1 New tariffs have since been put in place under different laws, including recently with close trading partners such as Canada.
At the same time, these tariff refunds have pushed the federal budget deficit (the gap between what the government spends and what it collects) higher, with the national debt surpassing $40 trillion for the first time ever. This has raised questions about how much it will cost the government to borrow money over the long term.2
While some investors have understandable concerns about these developments, the impact on investment portfolios has been limited. In fact, markets have performed well during this period, with broad market indexes reaching new all-time highs. This is a reminder of how important it is to keep these events in perspective, since markets have done well across many different trade and economic environments throughout history.
So what do you need to know about the latest developments?
Tariff refunds are making their way back to businesses
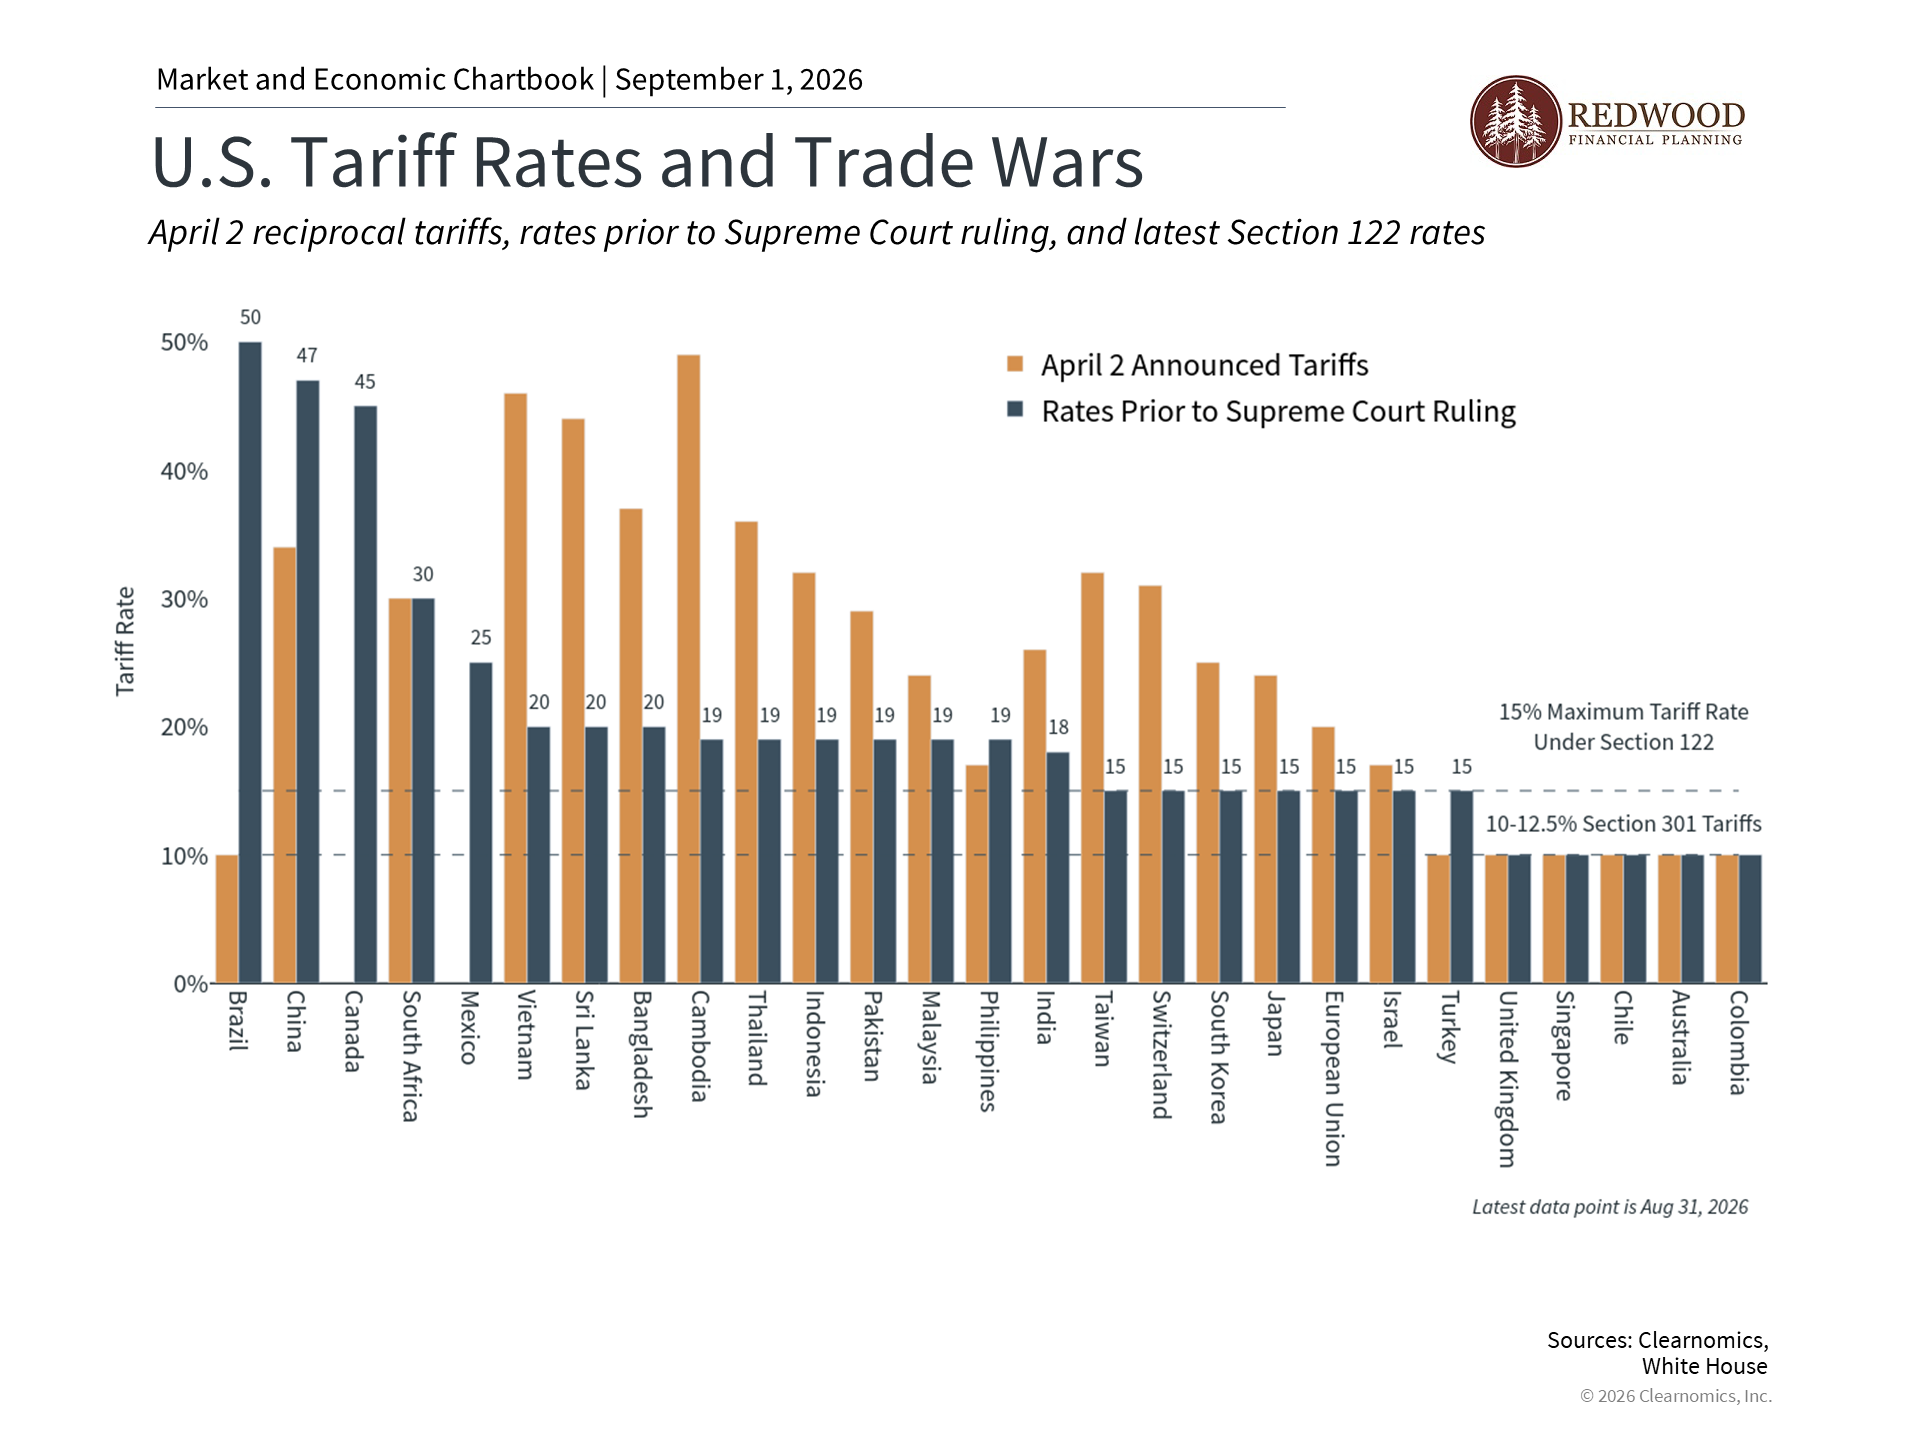
In February, the Supreme Court ruled that billions of dollars in tariffs collected under a law called the International Emergency Economic Powers Act (IEEPA) had been unlawfully charged. Markets generally reacted positively to this news, because tariffs are typically seen as an added cost to consumers and businesses. Reversing them was expected to be good for the overall economy.
Following the ruling, companies that had paid those tariffs became eligible for refunds, which are currently being paid out. According to U.S. Customs and Border Protection, $129 billion in refund claims had been accepted for processing, representing a significant share of the total amount owed.3 Data from the Treasury shows that tariff refunds have exceeded new tariff collections since May, meaning the government has been paying out more than it has been taking in for three months in a row.4
June was particularly notable, marking the single largest monthly amount of refunded tariffs ever recorded. In that month, $49.2 billion was returned to businesses compared to just $23.6 billion collected in new tariffs. With roughly 40% of total refunds still to be processed, the government is likely to continue paying out more than it collects in the months ahead.
On the surface, these refunds could act like a stimulus, helping companies strengthen their finances and invest more. However, it is important to remember that this cash was originally paid by each business in the first place. So while markets may view the refunds positively, they are largely a one-time event. They do not represent a lasting improvement in the underlying health of the economy, and they simply reverse last year’s tariff payments. Many companies also continue to pay tariffs under different laws.
For consumers, one concern was that tariffs could push up prices (a process called inflation). However, this did not happen to the degree many expected, as many retailers absorbed the extra costs or passed them on in indirect ways. This is one reason tariffs did not hurt consumer spending as much as some feared. It also makes it difficult to trace exactly how refunds will benefit households. For example, some shipping companies have begun returning refunds to customers who paid tariff surcharges directly, while some larger retailers have pledged to pass on savings through lower prices rather than direct payments.
Tariff refunds have added to the deficit and debt
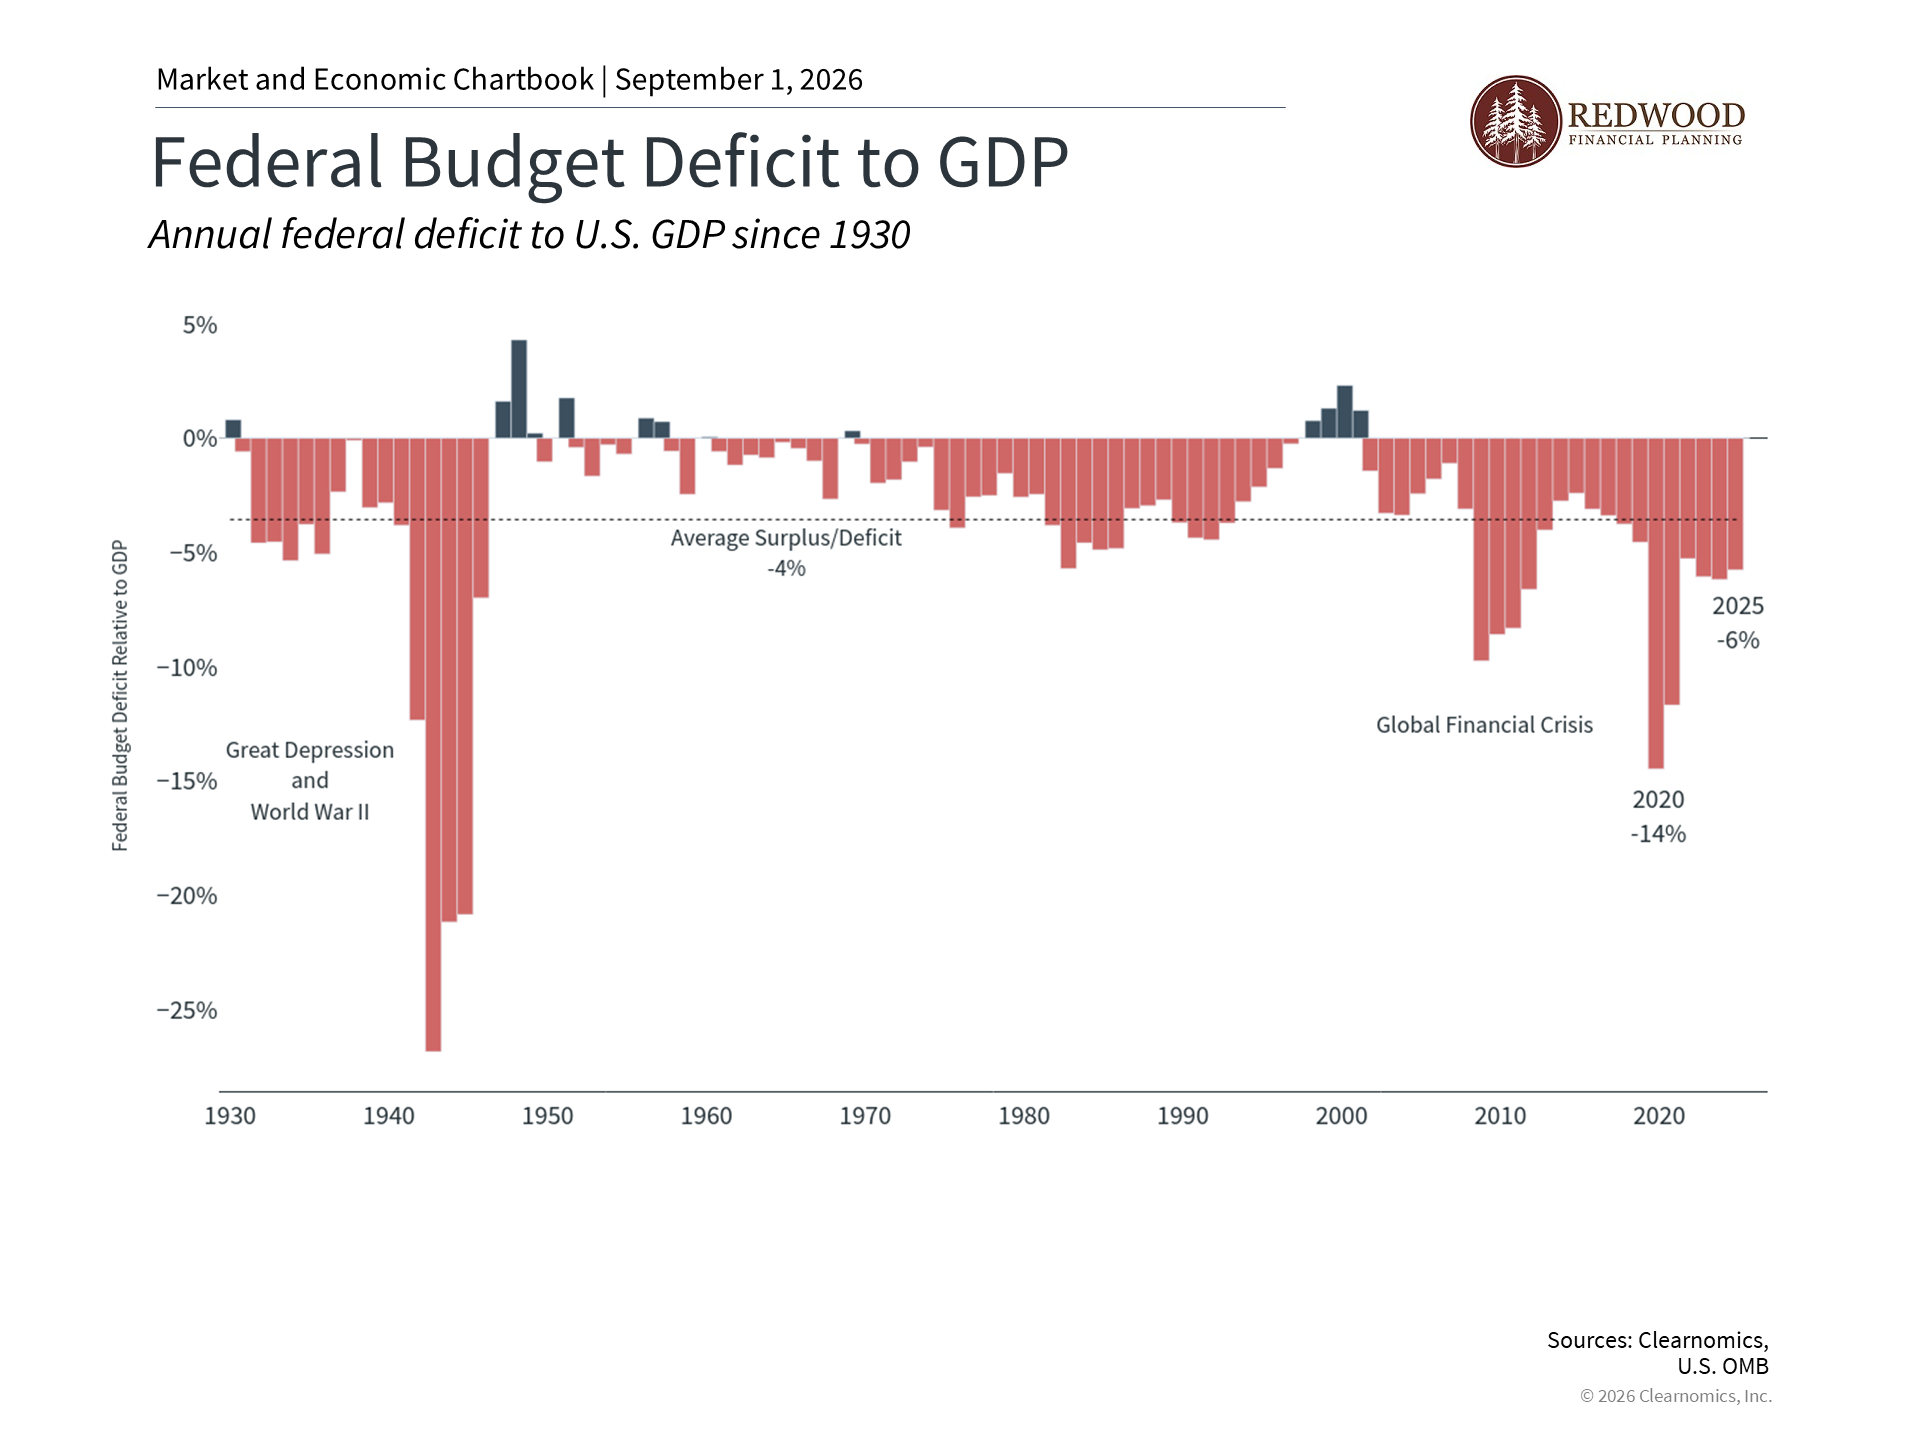
Tariff refunds have also reversed the boost that tariffs had provided to government revenues over the past year. The current annual deficit already stands at approximately $1.8 trillion, even though the government’s fiscal year does not end until September. This already surpasses the full-year 2025 deficit.5 The Congressional Budget Office recently projected that the full-year deficit will reach $2.1 trillion, roughly $200 billion more than was estimated earlier in the year.6
As a result, the national debt now exceeds $40 trillion for the first time in history. This figure has grown steadily over many decades as annual deficits have added up over time. The accompanying chart shows this long-run trend, with each year’s deficit contributing to the total debt. While tariff refunds are adding to the deficit in the short term, it is important to recognize that tariffs alone cannot close the budget gap. Larger and more complex issues, such as government programs like Social Security and Medicare, are much bigger drivers of the deficit and are difficult to address.
Many investors are understandably concerned about the national debt, but history shows it is important to separate these concerns from day-to-day investment decisions. Since 1970, the federal government has run a deficit in all but five years, with the only four budget surpluses occurring in the past thirty years. And yet, balanced investment portfolios have performed well over this same period. The deficit also tends to be at its highest when markets and the economy are struggling, which can coincide with the best times to invest. So while the past is no guarantee of future results, and the size of the national debt does create real challenges, making investment decisions based solely on the debt level has historically been counterproductive.
The government is working to manage borrowing costs
One effect of rising debt is its impact on interest rates, which are the cost of borrowing money. Long-term interest rates have climbed to multi-decade highs recently. This matters because when yields (the return paid to investors) on 10-year and 30-year U.S. Treasury bonds rise, borrowing becomes more expensive for both businesses and households.
To help manage this, the Treasury Department has increased its buybacks of U.S. Treasury securities, a tool used to help keep interest rates within a certain range.7 Other Treasury activities, such as supporting the Japanese Yen (Japan’s currency), may seem unrelated at first, but they are also intended to discourage governments like Japan’s from selling large amounts of Treasury securities, which could push rates even higher. That said, these efforts are small compared to the overall size of the Treasury market.
The accompanying chart puts interest rates in a longer historical context. Rates today are high compared to the past two decades, especially relative to the period when the Federal Reserve (the U.S. central bank) held rates near zero for many years. However, it is clear that rates are not extreme by historical standards. In fact, higher rates also create more opportunities for investors to earn income from bonds and other fixed-income investments.
Concerns about tariffs, the national debt, and interest rates could continue to grow as we approach the midterm elections in November. Investors should be careful not to let news headlines drive portfolio decisions. History shows that markets have navigated many periods of trade and fiscal uncertainty, and investors who kept a longer-term perspective were better positioned to reach their financial goals.
The bottom line
Tariff refunds and rising deficits are creating near-term fiscal challenges, but it’s important to keep these developments in perspective. Maintaining a balanced portfolio aligned with long-term financial goals remains the best way to navigate periods of fiscal uncertainty.
References
1. https://www.cbp.gov/trade/programs-administration/trade-remedies/ieepa-duty-refunds
2. https://fiscaldata.treasury.gov/datasets/debt-to-the-penny/debt-to-the-penny
3. https://storage.courtlistener.com/recap/gov.uscourts.cit.17270/gov.uscourts.cit.17270.25.1.pdf#page=3
4. https://fiscaldata.treasury.gov/datasets/monthly-treasury-statement/receipts-of-the-u-s-government
5. https://fiscaldata.treasury.gov/americas-finance-guide/national-deficit
6. https://www.cbo.gov/system/files/2026-08/61983-2026-07-MBR.pdf
7. https://home.treasury.gov/news/press-releases/sb0607


